

Long-term trends in the U.S. median house sales price.

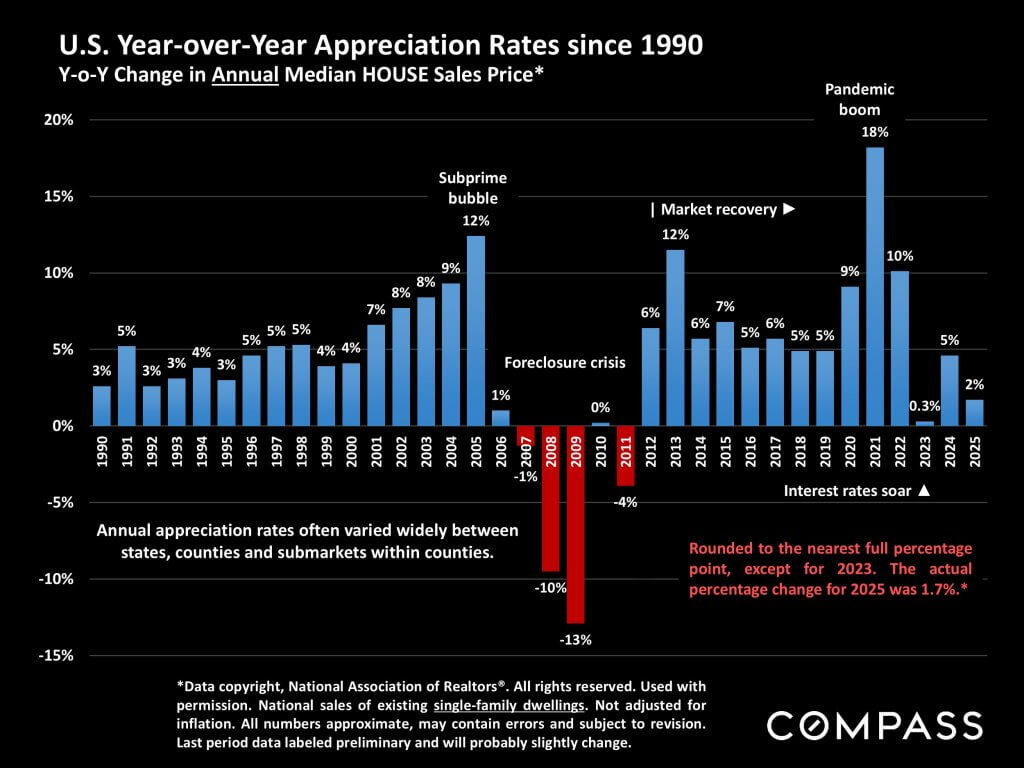
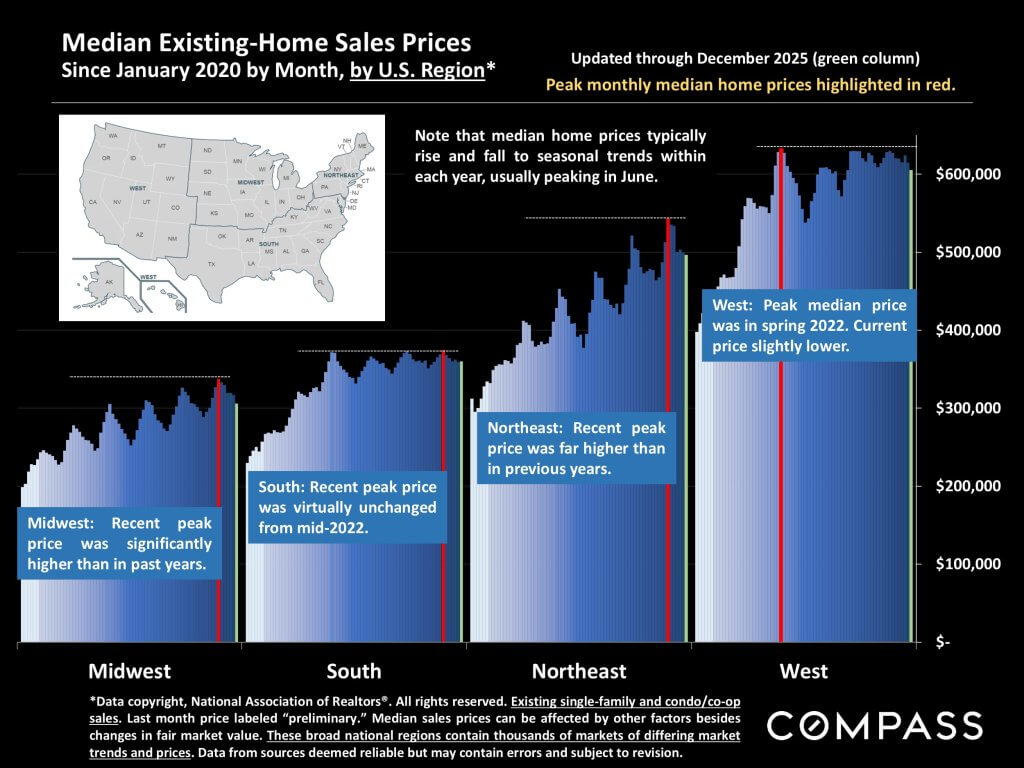
These next 2 charts look at regional median home sales prices on a monthly basis since January 2020, right before the pandemic struck, and then annual appreciation of regional home prices since 1990. The ups and downs within the calendar years on the first chart mostly reflect the effects of market seasonality.

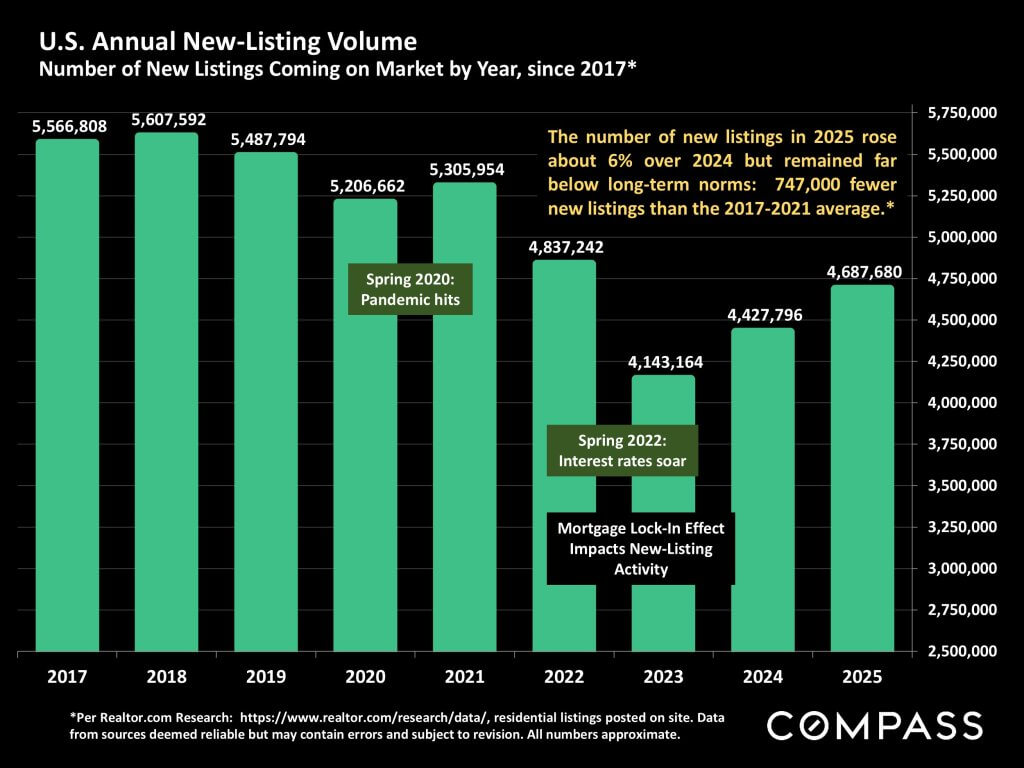
The number of new listings coming on market in 2025 increased about 6% in 2025. The “mortgage lock-in effect” – the reluctance of owners with low interest rate mortgages to sell – has continued to fade, a very positive development.
The average monthly number of listings on the market in 2025 rose about 14% from 2024 with significant effect on supply and demand dynamics. Buyers had more listings to choose from than at any time in the past 5 years. It may sound counter-intuitive, but more choices make buyers slower to act – as well as more likely to negotiate.

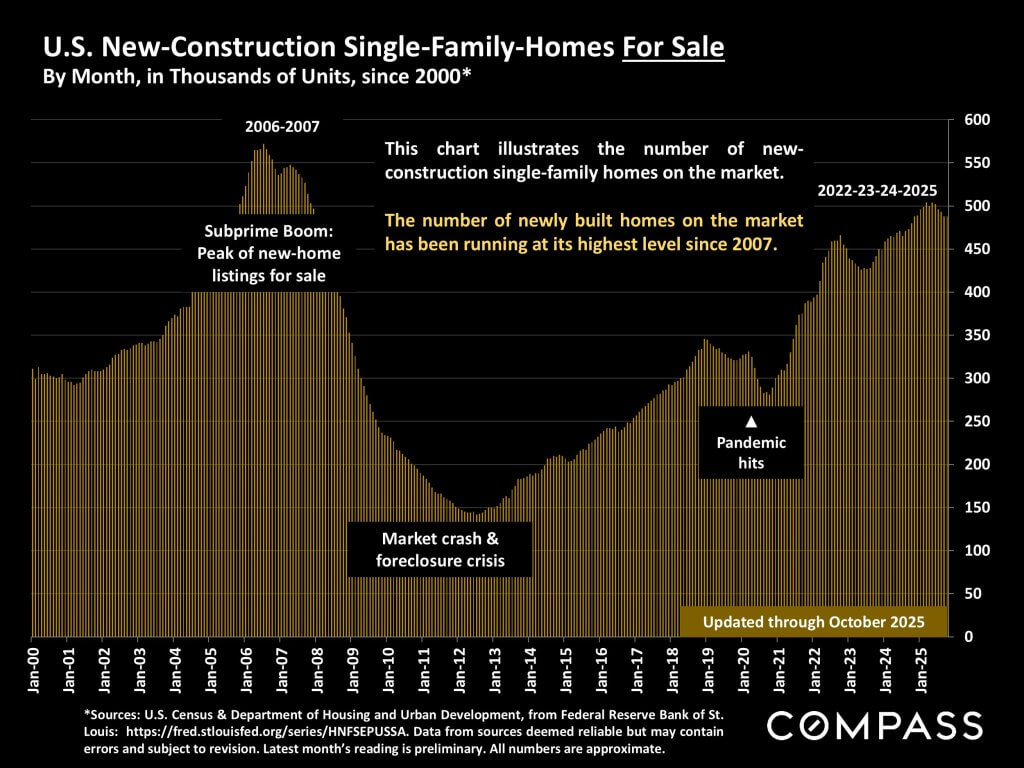
In some markets, especially in the south and southwest, the supply of existing homes for sale has been dramatically supplemented by the number of new-construction homes on the market.
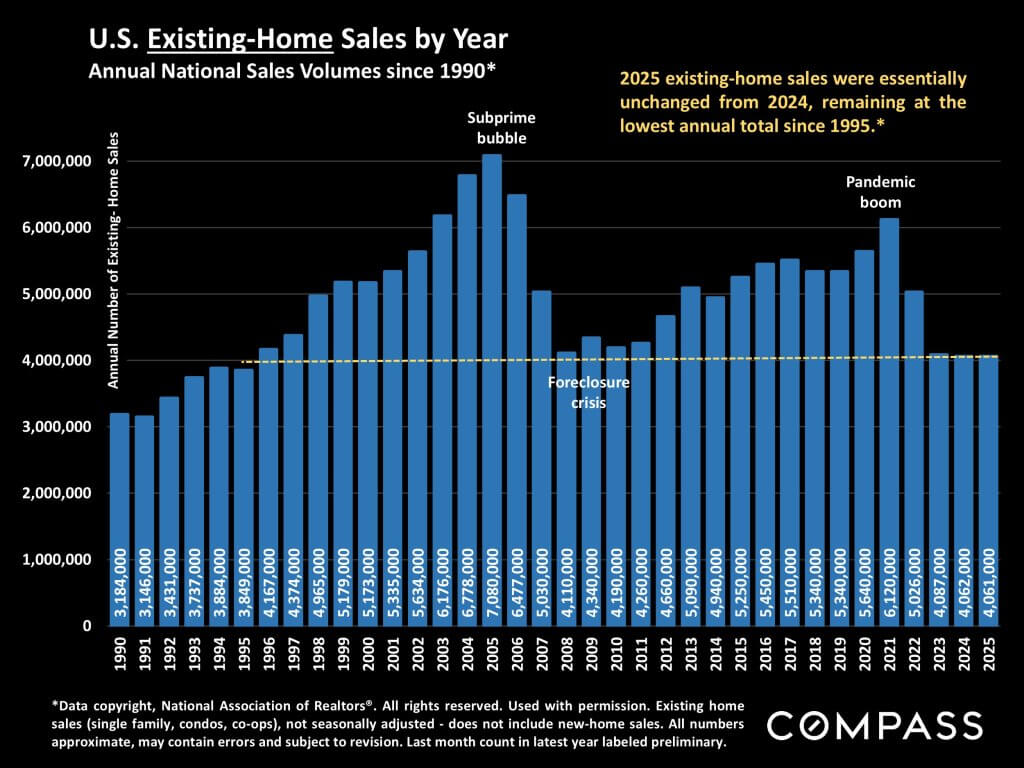
December 2025 saw a large surge in sales over November, which is not the typical seasonal trend and is a very positive indicator moving into 2026. Looking at annual sales volumes in the second chart below, 2025’s number was essentially unchanged from 2024, at a historically extremely low level of sales. We expect a rebound to occur this year.

In 2025, the increase in inventory outpaced demand, which made for a somewhat cooler market, and, on average, homes took longer to sell.

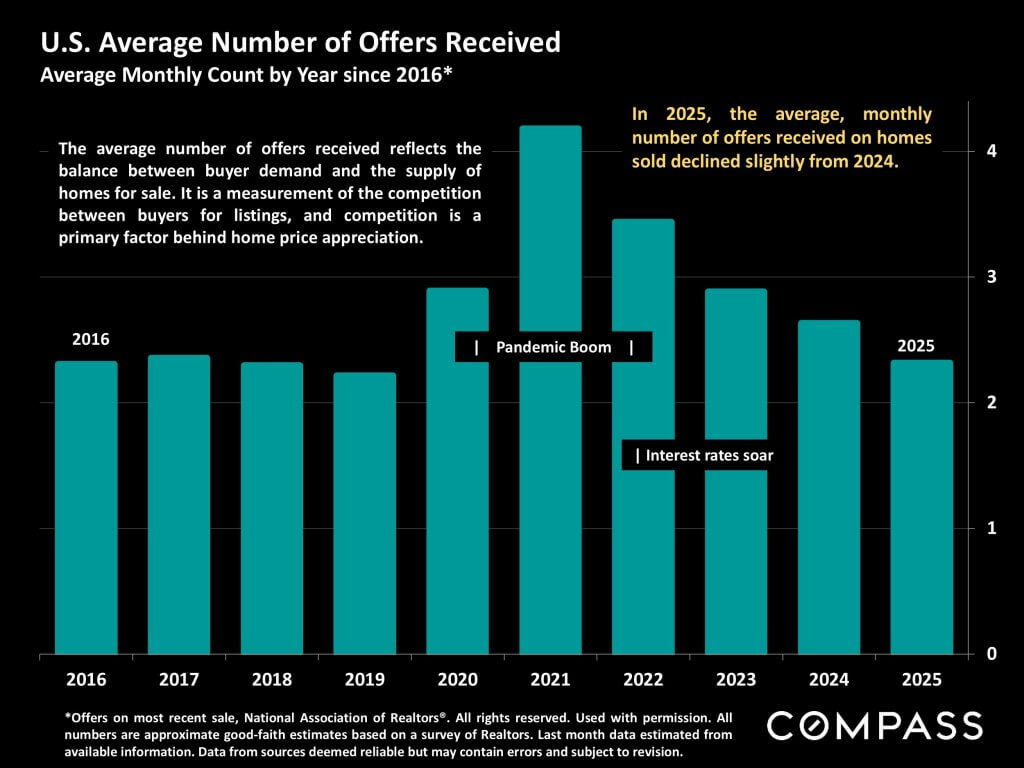
The level of competition for listings between buyers also declined, as measured by the average number of offers received on homes sold.
Reviewing economic indicators, the 2 biggest in 2025 were interest rates, which, falling dramatically since summer, are now close to multi-year lows, and stock markets, which are at or close to historic highs. The first has a huge impact on affordability, and the second on household wealth.

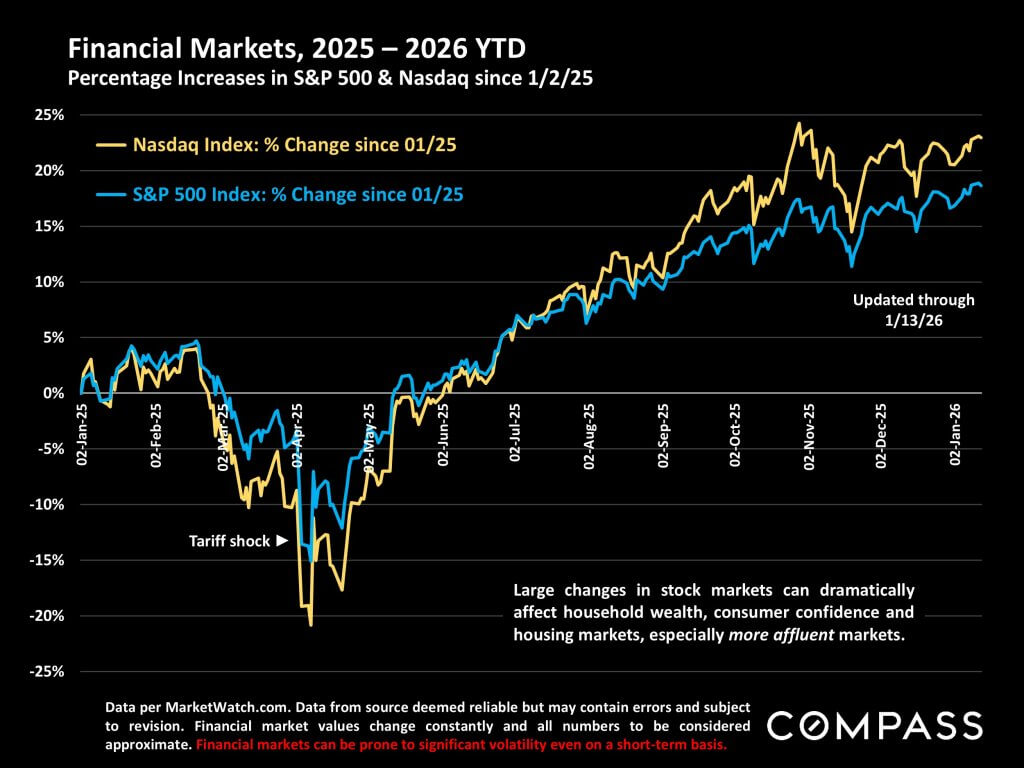
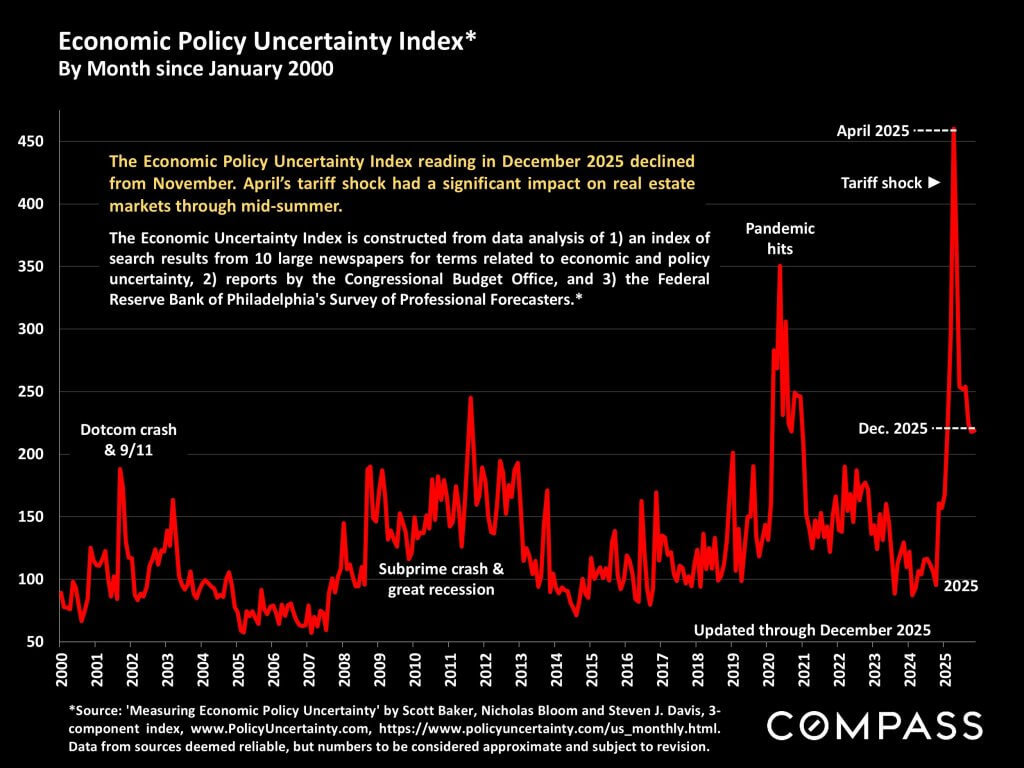
The Economic Policy Uncertainty Index below illustrates the political and economic volatility that erupted last spring, which slowed the real estate market considerably. The impact also shows up in the stock market chart above.
Employment and job security concerns have risen on both a macroeconomic level and within many households across the country.
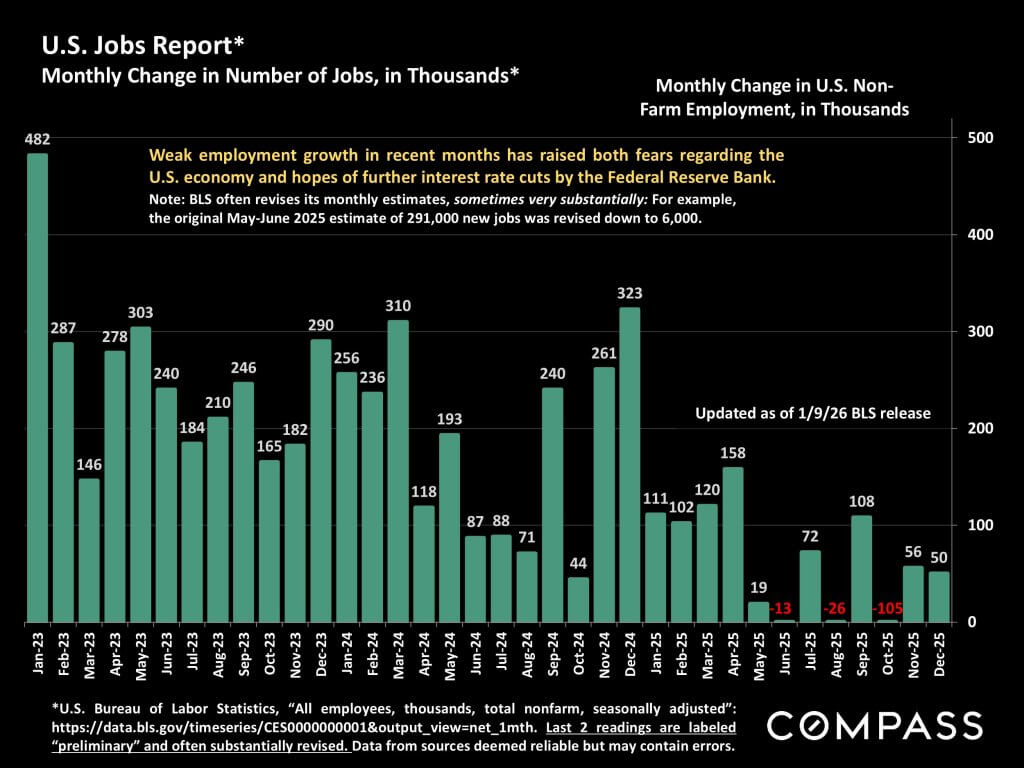
Inflation has remained relatively subdued, but has not been declining significantly. It remains a substantial concern of both consumers, especially less affluent households, and the Federal Reserve Bank.

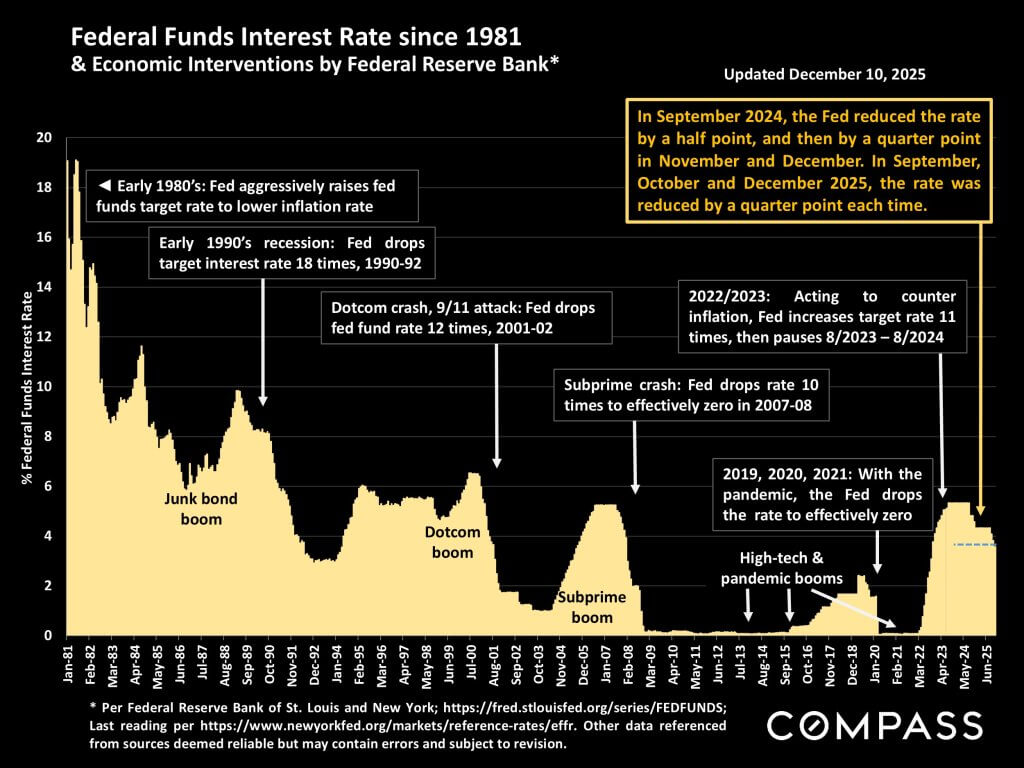
There are few political issues as contentious right now as the actions of the Federal Reserve Bank. The chart below reviews its history of benchmark rate changes since 1981.
Insurance has become an increasingly big factor in housing costs, and certainly one of the largest components behind rising insurance costs are natural disasters. 2025 was not affected by major hurricanes, but the Los Angeles fires were devastating and much of the country continues to be affected by substantial storm damage.

_ _ _ _
Source: compass.com
National and regional statistics are generalities, essentially summaries generated by thousands of unique, individual listings and sales occurring across different market segments. They are best seen not as precise measurements, but as broad, comparative indicators with reasonable margins of error. Anomalous fluctuations in statistics are not uncommon, and last period data should be considered preliminary estimates which may be revised in future updates. Different analytics programs sometimes define standard statistics – such as “active listings,” “days on market,” and “months supply of inventory” – differently: What is most meaningful are not specific numeric calculations but the trends they illustrate. Data from sources deemed reliable, but may contain errors, and subject to revision. All numbers to be considered approximate, and how these analyses apply to any particular property is unknown without a specific comparative market analysis.
Compass is a real estate broker licensed by the State of California operating under multiple entities. License Numbers 01991628, 01527235, 01527365. All material is intended for informational purposes only and is compiled from sources deemed reliable but is subject to errors, omissions, changes in price, condition, sale, or withdrawal without notice. No statement is made as to the accuracy of any description or measurements (including square footage). This is not intended to solicit property already listed. No financial or legal advice provided. Equal Housing Opportunity. Photos may be virtually staged or digitally enhanced and may not reflect actual property conditions.

