

National median home price trends since before the pandemic hit. Note the ups and downs relating to seasonal market dynamics: Median sales prices usually peak for the calendar year in June at the end of the spring selling season – when luxury home sales typically peak – and hit their low in mid-winter.

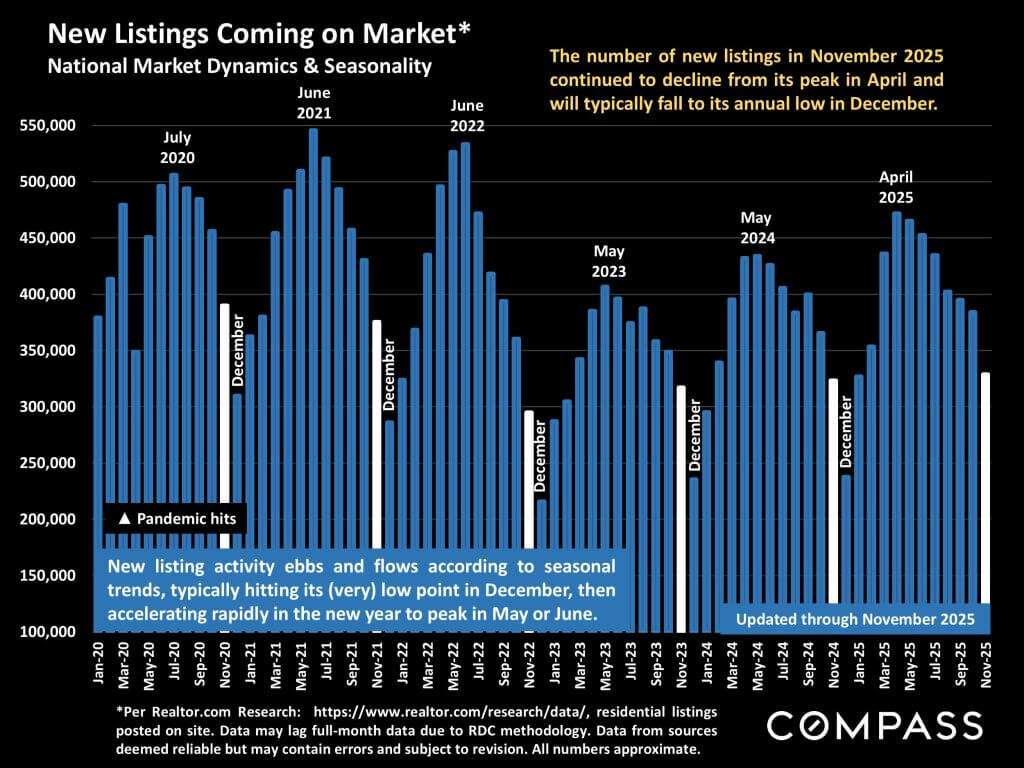
As is the usual seasonal trend, the number of new listings plummeted in November, and can be expected to plunge further in December. In January, new-listing activity will begin to revive and then accelerate through spring.
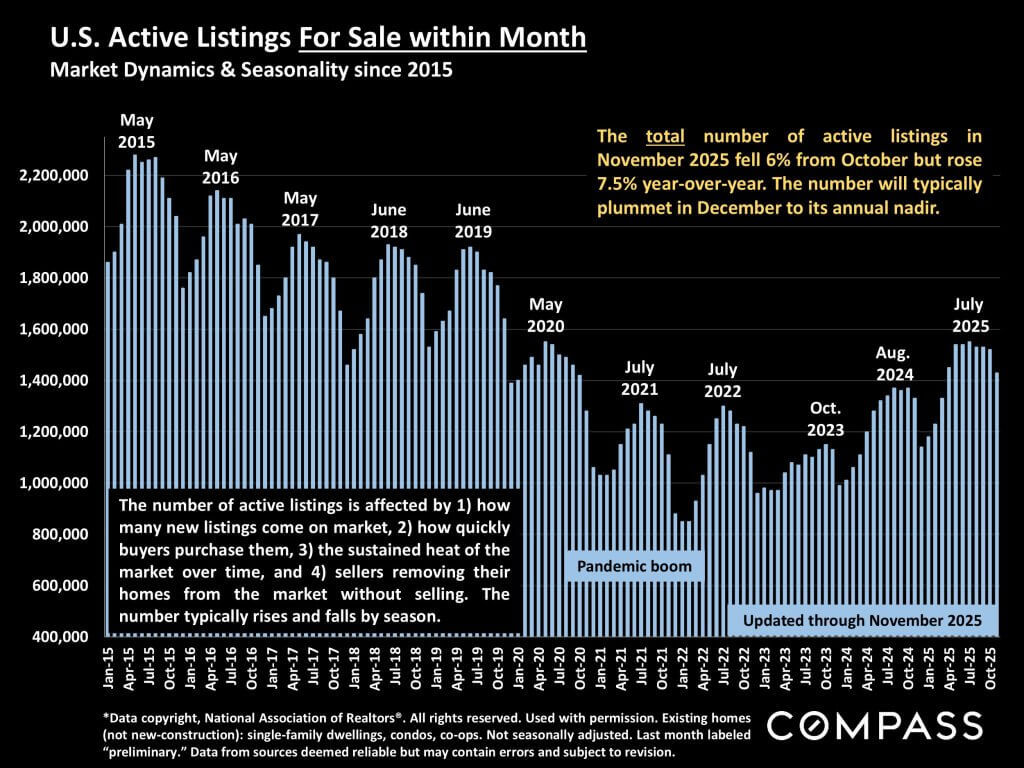
With the decline in new listings comes a drop in the total number of homes on the market, but inventory continues to run higher on a year-over-year basis.
As the supply of listings has increased and demand has remained relatively flat, the pending ratio continues to run low compared to readings over the past 5 years – especially as compared to the frenzied pandemic-boom market – but it is not particularly low by pre-pandemic norms.

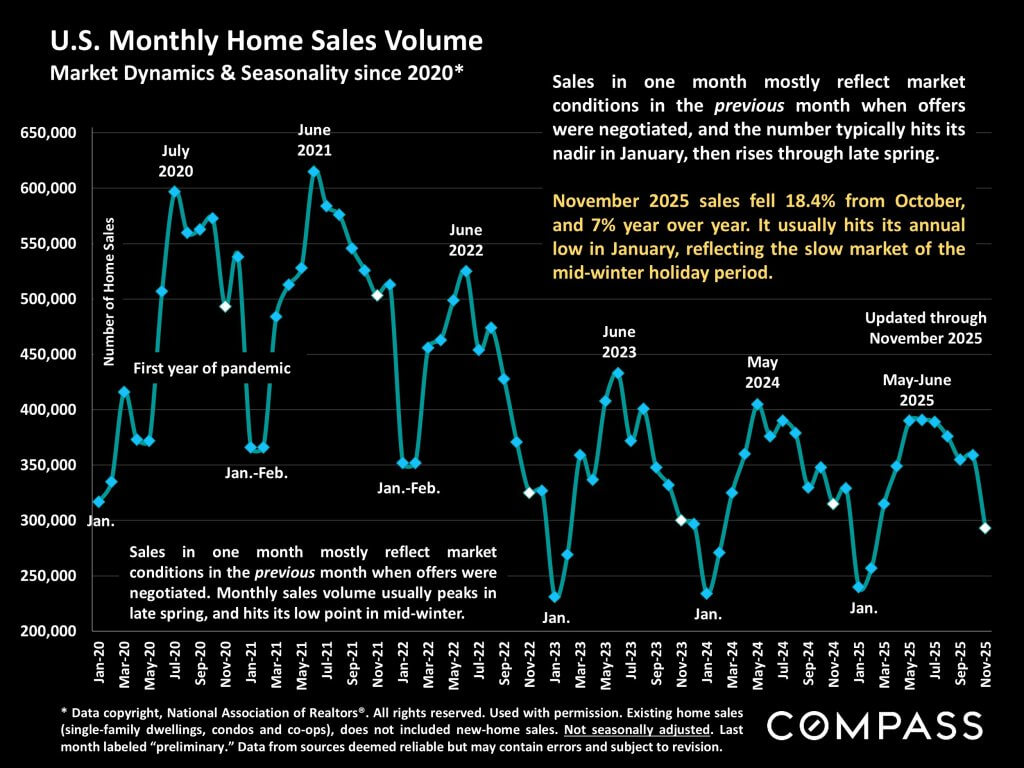
Sales volume also plunges during the mid-winter holidays (though some second-home markets buck this trend). Still, hundreds of thousands of homes continue to sell.
The number of price reductions has been falling since peaking in June (after the tariff shock and general economic volatility slammed the spring market). It is running significantly higher year over year, but that is mostly due to the increase in homes for sale. The percentage of active listings reducing asking price in November 2025, at 18%, was only 1% higher than in November 2024.

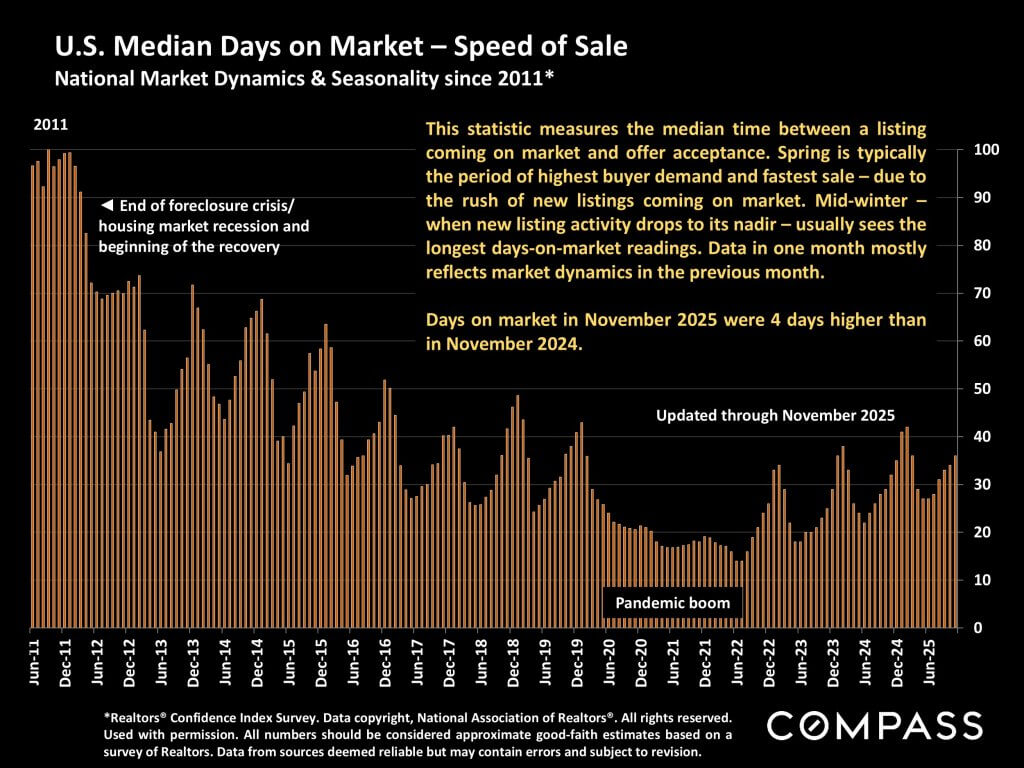
As the number of new listings dwindles, more of the sales taking place in the last months of the year are of older listings, which pushes up the overall days-on-market calculations. With the rush of new listings in spring – and how quickly buyers snap them up – this metric typically plunges to its lowest point of the year.
Our chief economist, Mike Simonsen, has just issued his comprehensive review of market, macroeconomic and demographic factors and trends, and how he expects them to affect the 2026 housing market. For those interested in a deep dive into the data, click on the slide below to access his full report and forecast.

National and regional statistics are generalities, essentially summaries generated by thousands of unique, individual listings and sales occurring across different market segments. They are best seen not as precise measurements, but as broad, comparative indicators with reasonable margins of error. Anomalous fluctuations in statistics are not uncommon, and last period data should be considered preliminary estimates which may be revised in future updates. Different analytics programs sometimes define standard statistics – such as “active listings,” “days on market,” and “months supply of inventory” – differently: What is most meaningful are not specific numeric calculations but the trends they illustrate. Data from sources deemed reliable, but may contain errors, and subject to revision. All numbers to be considered approximate, and how these analyses apply to any particular property is unknown without a specific comparative market analysis.
Compass is a real estate broker licensed by the State of California operating under multiple entities. License Numbers 01991628, 01527235, 01527365. All material is intended for informational purposes only and is compiled from sources deemed reliable but is subject to errors, omissions, changes in price, condition, sale, or withdrawal without notice. No statement is made as to the accuracy of any description or measurements (including square footage). This is not intended to solicit property already listed. No financial or legal advice provided. Equal Housing Opportunity. Photos may be virtually staged or digitally enhanced and may not reflect actual property conditions.

